Category: Stock Market

My original plan for this blog was to have entries related to its title. However, I’m including the stock market because of conversations with other students at Harald Harb’s Blue/Dark Blue ski camp.

My interest in this area grows out of my education, work, and an interest in implicit assumptions – either in logic or in mathematical formulations.

  • Investing In An Inefficient Market

    Twenty-five years ago, after I learned that the stock market had become inefficient, I began to think about investing in an inefficient market.

    Together with a friend who was also an ex-student, I attempted to start an investment management firm. This didn’t work for a variety of reasons, but I used the same analysis I discussed in my Why The Stock Market Is Inefficient and Why Market Efficiency Is Important posts to model an investment strategy. That is the strategy I will present below. How well did it work? It beat the market by more than 4% per year over all periods tested. However, such a test has potential biases and the market may be very different today – so beware! I am not responsible for the results of using the analysis I describe below!

    Caveat: I don’t do investment management – not even for my own funds; someone else does it for me. I do this because it seems best for me; the same “transient enthusiasms” that will populate this blog distract me from managing my investments. Since I doubt that I can manage them well, I don’t do it.

    Steps To An Investment Decision

    Step 1: Find potentially under-priced companies – low P/E companies are a good start.

    Step 2: Use the Fruhan model to find which low P/E companies are actually under-priced.

    Step 3: Evaluate the under-priced companies – apply conventional financial, strategic, and market analysis to determine if the under-priced companies are well-run, effective companies. That is, if you consider them “good”.

    Step 4: Watch the “good” under-priced companies for better-than-market momentum – you are looking for companies whose price is increasing faster than the market. This isn’t simple momentum, which expects the beat-the-market performance to continue because it exists. Your price momentum is biased in your favor by your earlier steps: The logic is: because the company is under-priced, the company is more likely to continue to beat the market until it is over-priced.

    Deciding When To Sell

    Watch the price momentum:

    • If the price momentum falls below the market
      • If the company is fully or over-priced, then you should sell the stock
      • If the company is under-priced, then perhaps you should sell the stock and buy another Step 4 company

    The “perhaps” statement above is the problem. For me, logic doesn’t help with the decision; my preference is to test the strategies with some market data – but I no longer have this. So, basically, my advice here is to “wing it”.

    The Fruhan Model

    The chart below is found on pages 12-13 of William Fruhan’s Financial Strategy book1.

    Here are the steps to use the model:

    1. Estimate the percentage point spread of extraordinary returns (-5, 0, +5, +10, +20)– these are in percent; compare the return on equity to that expected by the market.
    2. Estimate the number of years that extraordinary returns are expected (5, 10, 15, 30)– to address this you need to know why and how those returns were achieved.
    3. Estimate how much of the earnings can be reinvested in the extraordinary returns (0.3, 0.5, 0.7, 1.0, 2.0)– again, this requires that you know how the returns were achieved.
    4. Find the value in the chart; it is the multiple of the company’s book value that the extraordinary returns have justified.

    Note: When I do the above four steps I use the adjustments I recommend in my Book Value And The Cost Of Capital post and I recalculate the return on equity with those adjustments.

    I highly recommend that you obtain and read Fruhan’s Financial Strategy book because it has insights beyond the model and the mathematics that generated the model.

    This approach could also be used with over-priced companies by selling short. However, this is more risky as you could lose your entire investment if the stock price increases enough. Additionally, there is usually a carrying cost for short sales plus you must pay any dividends that the company issues. These combine to limit the potential returns of short selling. Thus, the risk-adjusted returns are less.

    Relating Investment Strategy To Market Efficiency

    Buying under-priced (and selling over-priced) stocks aids market efficiency – it’s effect is weighted by the amount invested. However, the data that I analyzed twenty-five years ago showed that some mis-priced stocks remained mis-priced for decades. This is the reason that we added the momentum requirement before purchase. A single small investor can expect to have no effect on market efficiency. My hope is that this and my other stock market posts generate a broader interest.

    If this approach should become more widespread the returns will occur more quickly. As the market returns to efficiency then the returns will disappear – as the Efficient Market Hypothesis says they should. However, it took more than a decade for the market to become inefficient – so it should also take more than a decade for it to return to efficiency – and it may never do so.

    March 22, 2020

    Footnotes

    1 Fruhan, William E. Jr. (1979). Financial Strategy: Studies in the Creation, Transfer and Destruction of Shareholder Value. Homewood, Illinois: R. D. Irwin. OCLC878176877.
  • Why The Stock Market Is Inefficient

    Why The Stock Market Is Inefficient

    The stock market is inefficient because the Efficient Market Hypothesis (EMH) is believed. While this sounds peculiar, the EMH may be unique in becoming false because it is believed.

    Virtually anything that you read says that we have an efficient market – but what does that mean? Here’s a definition, the Business Dictionary says: “Market where all pertinent information is available to all participants at the same time, and where prices respond immediately to available information. Stock markets are considered the best examples of efficient markets.”

    That sounds good; but what makes it happen? Here’s the explanation I was taught: If a stock price falls below its “proper” value then investors will purchase that stock and drive its price up until it is properly priced; the converse is true for overvalued stocks. Therefore, stocks are “properly” (efficiently) priced.

    So, the stock market is efficient because investors are looking for mis-priced stocks – that seems reasonable. What do you think would happen if we taught everybody that the market is efficient for fifty years? Do you think investors would still be looking for mis-priced stocks after being told for so long that there are none? I don’t – and the problem is, we have done exactly that.

    So, why does everybody believe the market is efficient?

    The Efficient Market Hypothesis (EMH)

    The logic behind the EMH was first proposed around 1900. It became popular in the 1960s due to Paul Samuelson and Eugene Fama; it became mainstream in the late 1960s by inclusion in the Finance textbooks of the time. Here’s a formal definition from Wikipedia:

    The efficient-market hypothesis (EMH) is a hypothesis in financial economics that states that asset prices reflect all available information. A direct implication is that it is impossible to “beat the market” consistently on a risk-adjusted basis since market prices should only react to new information. Since risk adjustment is central to the EMH, and yet the EMH does not specify a model of risk, the EMH is untestable.1 As a result, research in financial economics since at least the 1990s has focused on market anomalies, that is, deviations from specific models of risk.2

    The EMH is why everybody believes the market is efficient. Note the “H” for “hypothesis”, that’s a formal simile for “I think”. It might be true – but it’s called “untestable” – so it’s just an idea.

    So what does it take for the EMH to be true? The minimum is a large number of investors (or computers) looking for mis-priced stocks. But if the EMH is true, why would they waste their time looking for what never will be found? The only answer I’ve been able to think of is that they don’t believe the EMH – so the EMH implicitly requires that it be disbelieved. I therefore conclude:

    If nobody believes the EMH then it will be true.
    If everybody believes the EMH then it will be false.

    Testing Market Efficiency

    Fama asserted in 1970 that the EMH cannot be tested because the EMH doesn’t provide a method for estimating risk. Regardless, I just can’t believe that so fundamental an idea cannot be tested.

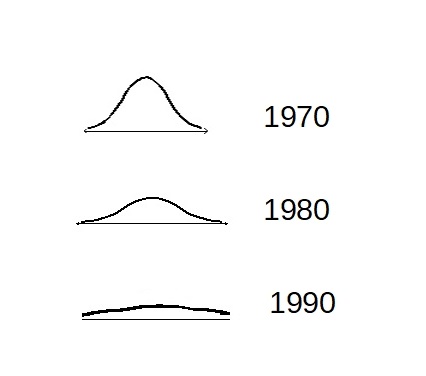
    In the 1990s I thought of an approach: Divide each stock’s market value by a discounted cash flow estimate of its value3; I termed this Market/Model. As I then had access to Compustat data, I calculated this annually for each stock in the NYSE from the late 1960s to the early 1990s. Then, I plotted the frequency of these values for each year and compared the shape of the curves. In 1970 I found a strong central tendency, looking like a normal distribution:

    Typical bell curve (normal distribution), showing expected relationship between Market and Model values for an efficient market.

    by 1980 it had flattened:

    Much flatter bell curve, showing less relationship between Market and Model values, implying that the market is becoming inefficient.

    until, by 1990, the curve appeared almost flat.

    Almost flat bell curve, showing minimal relationship between Market and Model values.

    In an unpublished paper, I interpreted these results to indicate that the EMH has become false – for the reasons discussed above – and that the stock market is no longer efficient. I still believe both the results and the interpretation.

    So, why did I reach that conclusion?

    1. Virtually all financial theories about companies consider the (Model) value of a company to be that of its future cash flows – and I calculated a version of that.
    2. The Market value of a company ought to be similar to the Model value.
      • If they were identical, there would be a single line at 1.
      • Since they are only similar, they should be around 1, so that the plot should show most of the Market/Model values near 1.
    3. Therefore, if the market is efficient the Market/Model should show a strong central tendency – translation: It should show a hump in the middle. It doesn’t, so the market is not efficient.

    Forces Against Market Efficiency

    There have been no forces (or voices) for market efficiency since the EMH was first proposed – simple belief in the EMH has accomplished the opposite.

    • Education
      • Since the late 1960s college business majors and MBAs have been taught the EMH – and have accepted it as true.
      • The Internet is a major source of impromptu education – and teaches the EMH as true.
    • Institutions – mutual funds and retirement funds
      • Stocks held by institutions grew steadily from 5% of the stock market after World War II to 80% today.
      • Institutions choose highly-trained people to manage their portfolios; these people generally believe the EMH and don’t waste their time looking for undervalued stocks.
      • Passive investment management – Index funds began in 1976 and now have more assets than active institutional management – these cannot look for mis-priced stocks.
        • As index funds own the same stocks in the same proportions as the index, they are technically neutral in their effect on market efficiency. However, I consider them a force against because they prevent their investments from being a force for market efficiency.
    • This leaves 20% of the market for individual investors – and they likely know of the EMH.

    Only 60% of the market could support efficiency (half the institutions plus individuals) and the market forces against efficiency have grown steadily since the EMH was proposed. So I believe that market efficiency has declined throughout this period. However, as I no longer have access to Compustat I can’t test it. (To anyone who does have access: I will happily cooperate in repeating and extending my analysis.)

    Miscellaneous thoughts

    There might be subsets of the markets that are efficient because the stocks in these subsets are more closely watched by investors and analysts.

    Why is market efficiency important? See my Why Market Efficiency Is Important post.

    April 5, 2020

    Footnotes

    1 Fama, Eugene (1970). “Efficient Capital Markets: A Review of Theory and Empirical Work”. Journal of Finance. 25 (2): 383. JSTOR 2325486

    2 Schwert, G. William (2003). “Anomalies and market efficiency”. Handbook of the Economics of Finance. doi:10.1016/S1574-0103(03)01024-0.

    3 Fruhan, William E. Jr. (1979). Financial Strategy: Studies in the Creation, Transfer and Destruction of Shareholder Value. Homewood, Illinois: R. D. Irwin. OCLC878176877.

  • Why Market Efficiency Is Important

    There has been a lot written on what market efficiency is, but much less on why it is important – probably because everybody knows the market is efficient. My view comes from my background in financial markets: Market efficiency is important because it affects the flow of capital in the economy. Ideally, we want capital (money) to go where it gets the best risk-adjusted return. If the market isn’t efficient, it doesn’t go there – and the economy doesn’t perform as well as it could.

    Over- And Under-Priced Companies

    In my Why The Stock Market Is Inefficient post I wrote about why I think the market is inefficient. Here I’ll show why that is important to investors and management.

    Over- And Under-Priced Companies In An Inefficient Market

    Investors do not look for mis-priced stocks, so stocks are not priced efficiently. Investors have poor outcomes and managements have good outcomes.

    1. Under-priced company
      1. Investors can purchase the stock – but the price doesn’t change and they make no profit because nobody else knows it’s under-priced.
      2. Management can buy back stockthis seems to work and arbitragers are probably watching for it.
    2. Over-priced company
      1. Investors can sell the stock, maybe even a short sale – but the price doesn’t change and they make no profit because nobody else knows it’s over-priced.
      2. Management can sell stock – they get more funds than they should; allowing them to hoard cash.

    The Result

    So what’s left? Randomness and fads! Some companies are considered “good”, and may become over-priced; and others are considered “bad”, and may become under-priced. William Fruhan’s Financial Strategy book1 shows both a tool for assessing stock value and – unfortunately old – examples of management actions when their companies are mis-priced. If it were written today there would be different examples – Apple and Tesla perhaps – but the conclusions would be the same.

    Consider the broader effects: When someone is considering starting a company what companies do they emulate? The “good”. When someone is considering investing in an IPO which do they prefer? Again, companies like the “good”. So no capital flows to the “bad” companies; existing ones languish and new ones are neither started nor funded. Too much capital flows to the “good” companies and they don’t know what to do with it – so they hoard cash.

    Remember, these “bad” companies are not bad necessarily, they are just not “good”, according to current thinking. But they have fewer opportunities to increase production or introduce new products – and the economy doesn’t have the products that it should have had.

    April 5, 2020

    Footnotes

    1 Fruhan, William E. Jr. (1979). Financial Strategy: Studies in the Creation, Transfer and Destruction of Shareholder Value. Homewood, Illinois: R. D. Irwin. OCLC878176877.